VAMboozled!: Just Released: National Council on Teacher Quality (NCTQ) Report on States’ Teacher Evaluation Systems
The controversial National Council on Teacher Quality (NCTQ) — created by the conservative Thomas B. Fordham Institute, funded (in part) by the Bill & Melinda Gates Foundation, and “part of a coalition for ‘a better orchestrated agenda’ for accountability, choice, and using test scores to drive the evaluation of teachers (see here; see also other instances of controversy here and here) — recently issued a 106 page document report titled: “State of the States 2015: Evaluating Teaching, Leading and Learning.” In this report, they present “the most comprehensive and up-to-date policy trends on how states [plus DC] are evaluating teachers” (p. i). The report also provides similar information about how principals are also being evaluated across states, but given the focus of this blog, I focus only on the information they offer regarding states’ teacher evaluation systems.
I want to underscore that this is, indeed, the most comprehensive and up-to-date report capturing what states are currently doing in terms of their teacher evaluation policies and systems; however, I would not claim all of the data included within are entirely accurate, although this is understandable given how very difficult it is to be comprehensive and remain up-to-date on this topic, especially across all 50 states (plus DC). Therefore, do consume the factual data included within this report as potentially incorrect, and certainly imperfect.
I also want to bring attention to the many figures included within this report. Many should find these of interest and use, again, given likely/understandable errors and inconsistencies. The language around these figures, as well as much of the other text littered throughout this document, however, should be more critically consumed, in context, and primarily given the original source of the report (i.e., the NCTQ — see above). In other words, while the figures may prove to be useful, the polemics around them are likely of less value…unless, of course, you want to read/analyze a good example of the non-research-based rhetoric and assumptions advanced by “the other side.”
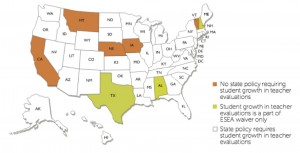
For example, their Figure B (p. i) titled Figure 1 below, illustrates that as of 2015 there were “just five states – California, Iowa, Montana, Nebraska and Vermont – that still have [emphasis added] no formal state policy requiring that teacher evaluations take objective measures of student achievement [emphasis added] into account in evaluating teacher effectiveness. Only three states – Alabama, New Hampshire and Texas – have evaluation policies that exist only in waiver requests to the federal government” (p. ii).
Figure 1. Teacher effectiveness state policy trends (2009-2015)
In addition, “27 states [now] require annual evaluations for all teachers, compared to just 15 states in 2009;” “17 states include student growth as the preponderant criterion in teacher evaluations, up from only four states in 2009…An additional 18 states include growth measures as a “significant” criterion in teacher evaluations;” “23 states require that evidence of teacher performance be used in tenure decisions [whereas no] state had such a policy in 2009;” “19 states require that teacher performance is considered in reduction in force decisions;” and the “majority of states (28) now articulate that ineffectiveness is grounds for teacher dismissal” (p. 6). These are all indicative of “progress,” as per the NCTQ.
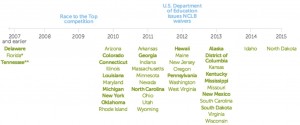
Nonetheless, here is another figure that should be of interest (see their Figure 27, p. 37, titled Figure 2 below), capturing when states adopted their (more or less) current teacher evaluation policies.
Figure 2. Timeline for state adoption of teacher evaluation policies
One of the best/worst parts of their report is in one of their conclusions, that there’s “a real downside for states that indulge critics [emphasis added] by delaying implementation, adopting hold harmless policies or reducing the weight of student achievement in evaluations. These short-term public relations solutions [emphasis added] reinforce the idea that there are a lot of immediate punitive consequences coming for teachers when performance-based evaluations are fully implemented, which is simply not the case (p. iii).
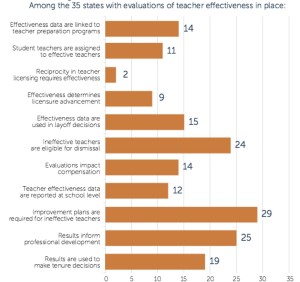
Ironic here is that they, immediately thereafter, insert their Figure D (p. v titled Figure 3 below), that they explicitly title “Connecting the Dots,” to illustrate all of the punitive consequences already at play across the nation (giving Delaware, Florida, and Louisiana (dis)honorable mentions for leading the nation when it comes to their policy efforts to connect the dots). Some of these consequences/connectors are also at the source of the now 15 lawsuits occurring across the nation because of the low-to-high stakes consequences being attached to these data (see information about these 15 lawsuits here).
Figure 3. “Connecting the dots”
To what “dots” are they explicitly referring, and arguably hoping that states better “connect?” See their Figure 23 (p. 29 titled Figure 4) below.
Figure 4. “Connecting the dots” conceptual framework
Delaware, Florida, and Louisiana, as mentioned prior, “lead the nation when it comes to using teacher effectiveness data to inform other policies. Each of these states connects evaluation to nine of 11 related areas” (p. 29) illustrated above.
Related, the NCTQ advance a set of non-at-all-research-based claims that “there has been some good progress on connecting the dots in the states, [but] unless pay scales change [to increase merit pay initiatives, abort traditional salary schedules, and abandon traditional bonus pay systems, which research also does not support], evaluation is only going to be a feedback tool [also currently false] when it could be so much more [also currently false]” (p. vi). They conclude that “too few states are willing to take on the issue of teacher pay and lift the teaching profession [emphasis added] by rewarding excellence” (p. vi).
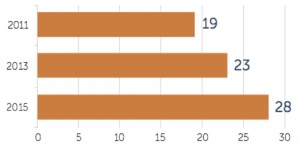
Related, NCTQ also highlights the state-level trends when tying teacher effectiveness to dismissal policies, also as progress or movement in the right direction (see their Figure 6, p.8, titled Figure 5 below).
Figure 5. Trends in state policy tying teacher effectiveness to dismissal policies
Here they make reference to this occurring, despite the current opt-out movement (see, for example, here) that has been taken up by teacher unions, setting to undermine teacher evaluations, protect teachers, and put students at risk — especially poor and minority students — by stripping states, districts, and schools “of any means of accountability [emphasis added] for ensuring that all children learn” (p. 10).
Finally, they also note that “States could [should also] do a lot more to use evaluation data to better prepare future teachers. Only 14 states with evaluations of effectiveness (up from eight in 2013) have adopted policies connecting the performance of students to their teachers and the institutions where their teachers were trained [i.e., colleges of education]” (p. 31). While up from years prior, more should also be done in this potential area of “value-added” accountability, as well.
See also what Diane Ravitch called “a hilarious summary” of this same NCTQ report. It is written by Peter Greene, and posted on his Curmudgucation blog, here. See also here, here, and here for prior posts by Peter Greene.
This blog post has been shared by permission from the author.
Readers wishing to comment on the content are encouraged to do so via the link to the original post.
Find the original post here:
The views expressed by the blogger are not necessarily those of NEPC.


