10th Period: The Quiet Importance of Ohio's Performance Index Score
Many in the charter school advocacy community have been pushing to have the state only judge charter schools by their so-called "value-added" scores -- the amount of student growth shown during the year on the state's battery of standardized tests. Among the advantages these advocates stress is how the value added scores tend to be less influenced by demographics than straight proficiency scores.
Value added measures have real limitations as well, including many critics who claim value added scores are equally problematic for accountability purposes as proficiency scores.
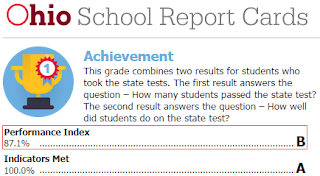
However, proficiency scores continue to be among the most important single state report card indicators. Why? Because according to state law, if a school district scores in the bottom 5 percent of performance index scores, charter schools can come to town. Performance index is calculated by weighting scores depending on how high or low students score on state proficiency tests.
So despite charter school advocates' admission that what testing critics have said for years -- that proficiency scores are closely tied to demographics -- and their insistence that value-added scores be the primary determinant of a school or district's success, these advocates have been silent on this fundamental provision of state law that determines whether a school district will have publicly funded, privately run schools competing for students and dollars.
Here's one reason why they may remain silent on this issue: Charter schools, which are meant to provide options to parents in districts with poor proficiency scores, have even worse performance index scores than the bottom 5 percent of districts.
According to the current list of "challenged school districts" put out by the Ohio Department of Education (the list was frozen after the 2013-2014 school year as Ohio transitions to its A-F report card), there are 24 districts that qualified then for charter schools under the performance index performance criterion. There are an additional 15 that qualify because they were part of the original pilot program (Lucas County schools) or are a big 8 urban district (Akron, Canton, Cincinnati, Cleveland, Columbus, Dayton, Toledo and Youngstown).
The median performance index score for those 24 "challenged school districts" was 83.058 (out of 120 possible) in 2013-2014. Do you know how many charter schools outperformed that score on the last report card? If you guessed 23, you'd be right.
That's 23 out of 265 charters that had performance index scores recorded by the state -- a staggeringly low 9 percent of Ohio charter schools. That does not include the 90 or so dropout recovery schools, which do not receive performance index scores, but that routinely rated as the worst performing schools in the state prior to receiving their far more lenient report card. For example, in the last yeardropout schools received performance index scores (2010-2011), they scored 10 points lower than their non-dropout recovery counterparts.
The amazing thing is there are fewer charters that currently outperform Ohio's lowest performing school districts than there are currently "challenged school districts" due to their poor proficiency scores!
More than 94 percent of money being spent on Ohio charter schools with performance index scores goes to charters currently with worse performance index scores than the school districts whose scores were so bad state lawmakers called them "challenged" enough to allow charter schools to come in to offer "better" options ...
6 percent of the time!
What do you suppose will be state lawmakers' response to this conundrum -- the alleged solution is even worse performing than the problem it was meant to solve? If you guessed nothing, you're cynical. But you're probably right.
This is also why I continue to compare district performance with charter school performance.
Sorry guys.
School districts' performance on the very measures charter advocates criticize the state for using to judge their favorite schools' performance is being used by the state to determine if charters should open in certain communities.
Yet that same state metric would designate more than 9 of 10 Ohio charter schools a "challenged school district" in desperate need of competition.
For those of you who would charge this comparison is unfair because performance index scores are overall lower today than they were in 2013-2014, applying the same performance index standard for a "challenged school district" today would result in nearly 6 in 10 charters scoring worse.
Again, the designation of a "challenged school district" remains how that school scored in 2013-2014.
But regardless of which criterion you use, charters overall just don't pass muster.
This blog post has been shared by permission from the author.
Readers wishing to comment on the content are encouraged to do so via the link to the original post.
Find the original post here:
The views expressed by the blogger are not necessarily those of NEPC.


