Shanker Blog: One Page Summaries of Your State's School Finance System
For the past few years, the Shanker Institute has been collaborating with Bruce Baker and Mark Weber of Rutgers University to publish the School Finance Indicators Database (SFID), a collection of finance and resource allocation measures for policymakers, journalists, parents, and the public.
The State Indicators Database (SID), the primary product of the SFID, is freely available to the public, but it includes about 125 variables. So, even if you know exactly the types of measures you are looking for, compiling the data for a state or a group of states might present a challenge. While we have tried to make the data accessible for non-researchers, we realize that it can still be difficult for a lot of people.
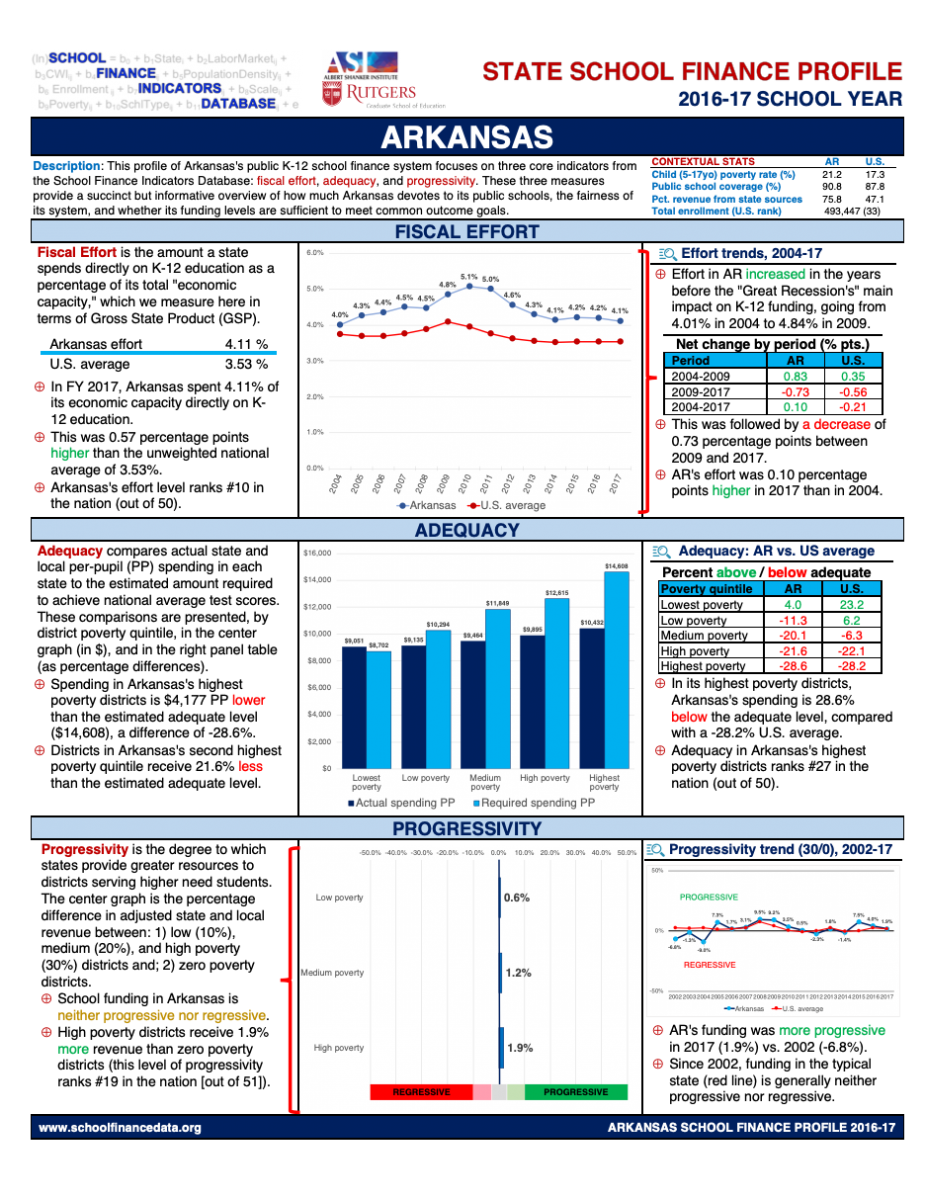
We have therefore just published 51 state school finance profiles (with help from ASI fellow Lauren Schneider), which pull together a digestible amount of information into one place for each state (and D.C.). You can download the profiles individually or as a group.
As with our annual report, the profiles present SID data for three "core" measures, which together offer an effective overview of the fairness and sufficiency of each state's finance system:
- Effort: how much of a state’s total resources or capacity are spent directly on public K-12 education;
- Adequacy: whether states provide districts with resources sufficient to meet common outcome goals;
- Progressivity: whether states allocate more resources to districts serving larger proportions of disadvantaged students.

Rather than bombarding users with as much data as possible on these three measures, we have instead presented a selection of key statistics explained in clear language. This includes, where appropriate, trends over time, as well as comparisons of each state with national averages.
It is important to note that the latest year of data presented in the state profiles is 2016-17, which means the data predate the coronavirus pandemic and accompanying economic recession by a few years. There is a lag in the release of national finance data, and so it will be some time before we are able to publish the SFID data for a time period that reflects the impact of this crisis (but we will be updating the profiles with the latest data annually).
We also know, however, that the features and performance of each state's system will shape the severity and duration of the current recession's impact on its school budgets, as well as its ability to withstand future economic crises. And, put simply, few (if any) states are even moderately well-equipped to handle the current crisis. Indeed, most are still recovering from the previous recession. If states are to have any chance of stemming the damage in this current crisis, they are going to have to change the way they fund their schools.
On the back of each profile you can find more detailed information about the indicators and notes about how they are presented and might be interpreted. This back page also lists the names of SID variables used, should readers wish to download and analyze the data for themselves. It is our hope that the profiles contribute to improving the quality and productivity of school finance debates and policymaking.
This blog post has been shared by permission from the author.
Readers wishing to comment on the content are encouraged to do so via the link to the original post.
Find the original post here:
The views expressed by the blogger are not necessarily those of NEPC.
