Shanker Blog: The Great Divergence In State Education Spending
When we talk about K-12 education spending inequality, we're usually talking about differences in resources between high- and low-poverty districts within states. But spending levels also vary between states, and that too matters for overall spending inequality in the U.S. How has this changed over the past 25 years? In other words, does K-12 spending vary more between states than it did a quarter century ago?
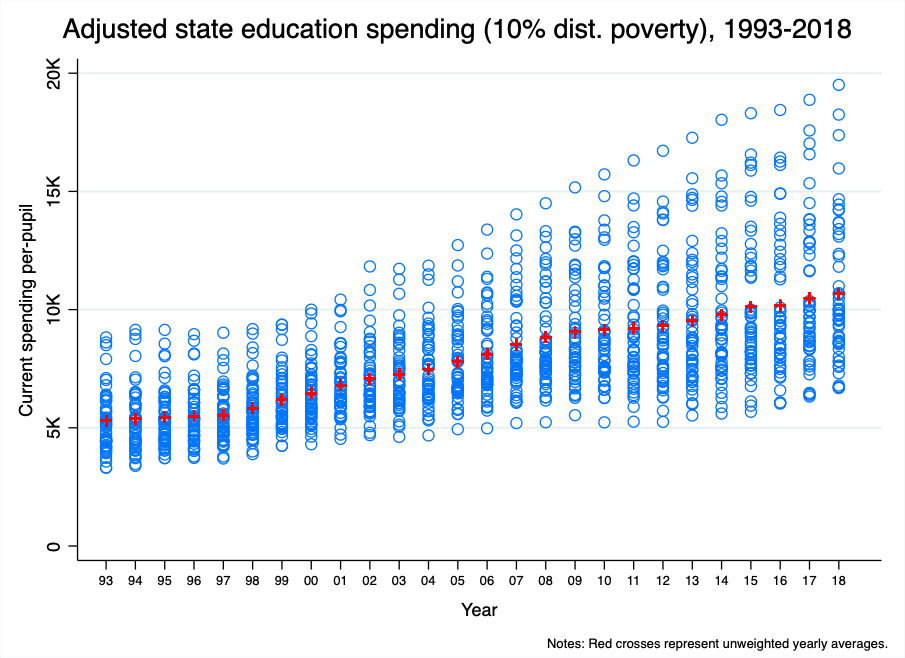
Let’s take a look at one simple way to visualize this trend. In the graph below, each blue circle is a state, and there one set of 51 states (including D.C.) for each year between 1993 and 2018 (the horizontal axis). On the vertical axis is total current spending in each state, predicted for a district in each state with a 10 percent Census child poverty rate (the graph is very similar regardless of poverty level). These spending levels also control for regional wage variation, district size, and population density, all of which affect the “value of the education dollar.” This allows for a better comparison between states (e.g., it costs more, on average, to hire teachers in Connecticut than in Alabama). The red plus signs within each year represent the unweighted average spending level across all states. These data are from the School Finance Indicators Database.
Our focus here is on the “spread” of states (blue circles) within each column (i.e., within each year). A larger spread, of course, represents greater variation (and, roughly speaking, more interstate inequality). The trend over time is a bit striking.

Throughout most of the 1990s and the first half of the 2000s, all but a small handful of states were clustered within the $3,000 to $8,000 range, a spread of about $5,000 per-pupil. Now, to be clear, this is a big span (particularly in these earlier years, when spending was lower), and it represents substantial interstate variation in spending. Even controlling for factors that affect costs, such as poverty and regional wage variation, some states spend a lot more than others.
Starting in the mid-2000s, however, a group of about 5-10 states start to break away from the pack, as it were. This divergence was clearly and severely exacerbated by the “Great Recession” of 2007-09. Spending decreased or stagnated in most states during the 2009-12 time period, which was when the shock of the 2007-09 recession “caught up” to states’ spending levels (the delay was due to the infusion of federal stimulus funds as well as the fact that recessions take a little time to show up in education spending levels). You can get a sense of this by looking at the trend in the red plus signs (the unweighted average), which flattens out between 2009 and 2012 (you might think of this period as the "public school recession").
Education spending, on average, started to recover around 2013, but the recovery was unequal. Spending in many states resumed a positive trajectory, but, in a lot of other states, the recession's impact was more persistent. As a result, by 2018 there were about 15-20 states that exhibited adjusted spending levels noticeably above the main pack, in stark contrast to the earlier years depicted in the graph, when states were grouped more closely together. The dots from left to right create a kind of sideways cone or tornado shape.
In other words, over the past 15 or so years, but particularly since (and largely due to) the Great Recession, there is increasing variation between states in their spending levels, which means increasing inequality of educational investment.
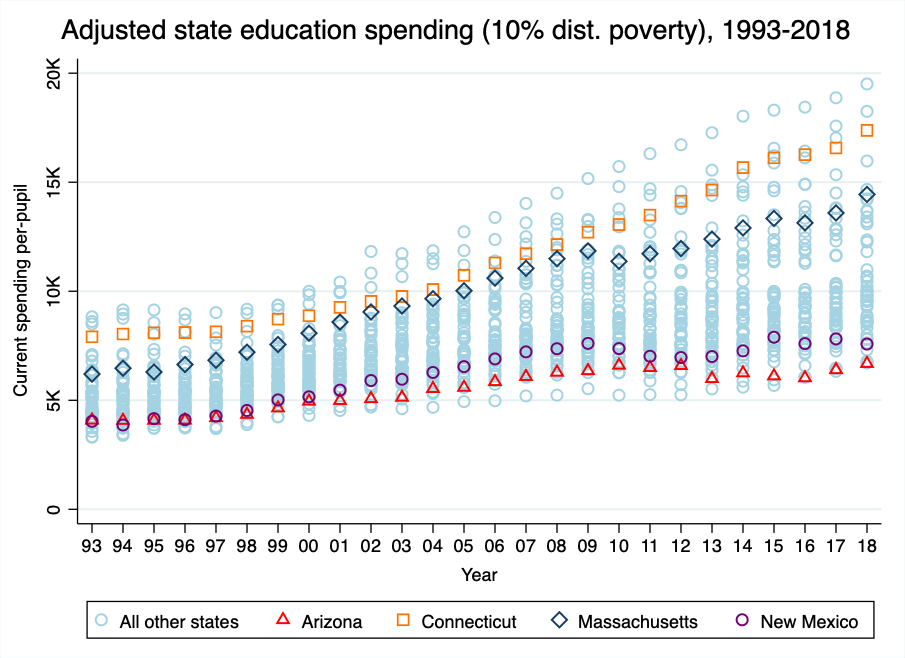
We might isolate the trend in a few states to get a better sense of what happened. The graph below is the same as the one above, but I’ve highlighted four states: Connecticut (orange squares); Massachusetts (blue diamonds); Arizona (red triangles); and New Mexico (purple circles).

Arizona and New Mexico started low in the pack and generally remained low during the 1990s and early- to mid-2000s (though New Mexico did move up a bit in the scrum). The subsequent (delayed) adverse impact of the 2007-09 recession on education spending occurred in virtually all states, but in states like Arizona and New Mexico, there was less reinvestment once economies started to recover. Consequently, even ten years after the onset of the Great Recession, adjusted spending levels in these states are roughly at their pre-recession levels.
Connecticut and Massachusetts, like Arizona and New Mexico, also experienced some ill effects of the recession on their school spending. This is particularly true in Connecticut, where, for example, spending dropped quite a bit between 2009 and 2010 (in Massachusetts, spending growth slowed). Yet both states increased or resumed their levels of investment in public schools as their economies recovered. As a result, they are among the states in which adjusted spending continued to rise post-recession, and by 2018 they were two of the highest-spending states in the U.S.
Stepping back for a moment, it bears mentioning that some states are better equipped than others to handle economic downturns. Massachusetts and Connecticut have comparatively large economies from which to draw revenue, whereas Arizona and especially New Mexico have a smaller “economic pies” to devote to their schools and other public services. But there is an important difference between the two latter, lower-capacity states. New Mexico devotes a relatively large share of that capacity to public schools—i.e., the state exhibits high “fiscal effort.” This is a big reason why New Mexico’s spending increased during the late 1990s and early 2000s. Once the recession hit, however, the state’s already-limited capacity contracted further, thus constraining its revenue yield and prolonging the recovery of its school spending.
Arizona, on the other hand, puts forth the lowest effort level of any state in the nation, which means that its schools (and other public services) are shortchanged even during good times, but the damage is particularly bad and persistent during downturns. As a result, by 2018 adjusted spending in Arizona was the lowest of any U.S. state.
These four states exemplify the overall trend of increasing variation of and, thus, inequality in K-12 spending that has occurred over the past 25 years. While there have always been higher- and lower-spending states, the gaps have widened substantially. Part of this is due to differences between states in their economic capacities (and in the recession's impact), but a big factor is also deliberate choices on the part of policymakers (e.g., fiscal effort). Some states maintained or increased their investment levels during the economic recovery and some did not. If the latter states take the same course of action during the current recovery, this will happen again.
This blog post has been shared by permission from the author.
Readers wishing to comment on the content are encouraged to do so via the link to the original post.
Find the original post here:
The views expressed by the blogger are not necessarily those of NEPC.
